
Is the change concentrated in one factory or production line?
← All projects
Case study · Phase one
Manufacturing Intelligence Platform
An end-to-end analytics engineering project spanning deterministic synthetic data, Databricks Bronze/Silver/Gold pipelines, governed SQL metrics, automated acceptance checks, and public Tableau dashboards for manufacturing quality investigation.
View source on GitHub ↗The story
Suppose I am responsible for manufacturing quality.
This morning, the yield drops. I can see the number changed — but the number itself does not tell me why.
Is it a product, component, supplier, or a particular defect pattern?
Before acting, I need consistent metrics and traceable data — not just another chart.
So the real question becomes:
Can I move from “yield dropped” to evidence that explains where and why?
01CollectManufacturing facts
→ 02GovernBronze · Silver · Gold
→ 03MeasureFPY · Defects · Volume
→ 04InvestigateFactory · Product · Supplier
→ 05ExplainDashboard · RCA
The actual result
Instead of stopping at the KPI, I can keep drilling down until the change has evidence behind it.
Interactive result
Three views for moving from signal to evidence.
Every public view uses deterministic synthetic data.
Interactive result
01 Executive Overview
A management view of FPY, defect rate, production volume, trends, and product mix.
Open on Tableau Public Interactive result
02 Manufacturing Quality
Quality trends and Pareto analysis across factories, products, and suppliers.
Open on Tableau Public Interactive result
03 Root Cause Analysis
Drill-down evidence for tracing quality movement to lines, components, suppliers, and defects.
Open on Tableau PublicSystem architecture
From controlled data to explainable action.
The first phase completes the production-like path from synthetic source data to governed analytics and public dashboards.
SOURCESynthetic DataPython · Parquet · S3
LAKEHOUSEBronze · Silver · GoldDatabricks · Delta
SEMANTICSGoverned MetricsSQL · Quality checks
INSIGHTTableau · RCAEvidence · Action
ASSURANCE Contracts · Idempotency · Quarantine · Automated acceptance
Detailed architecture
Full system architecture
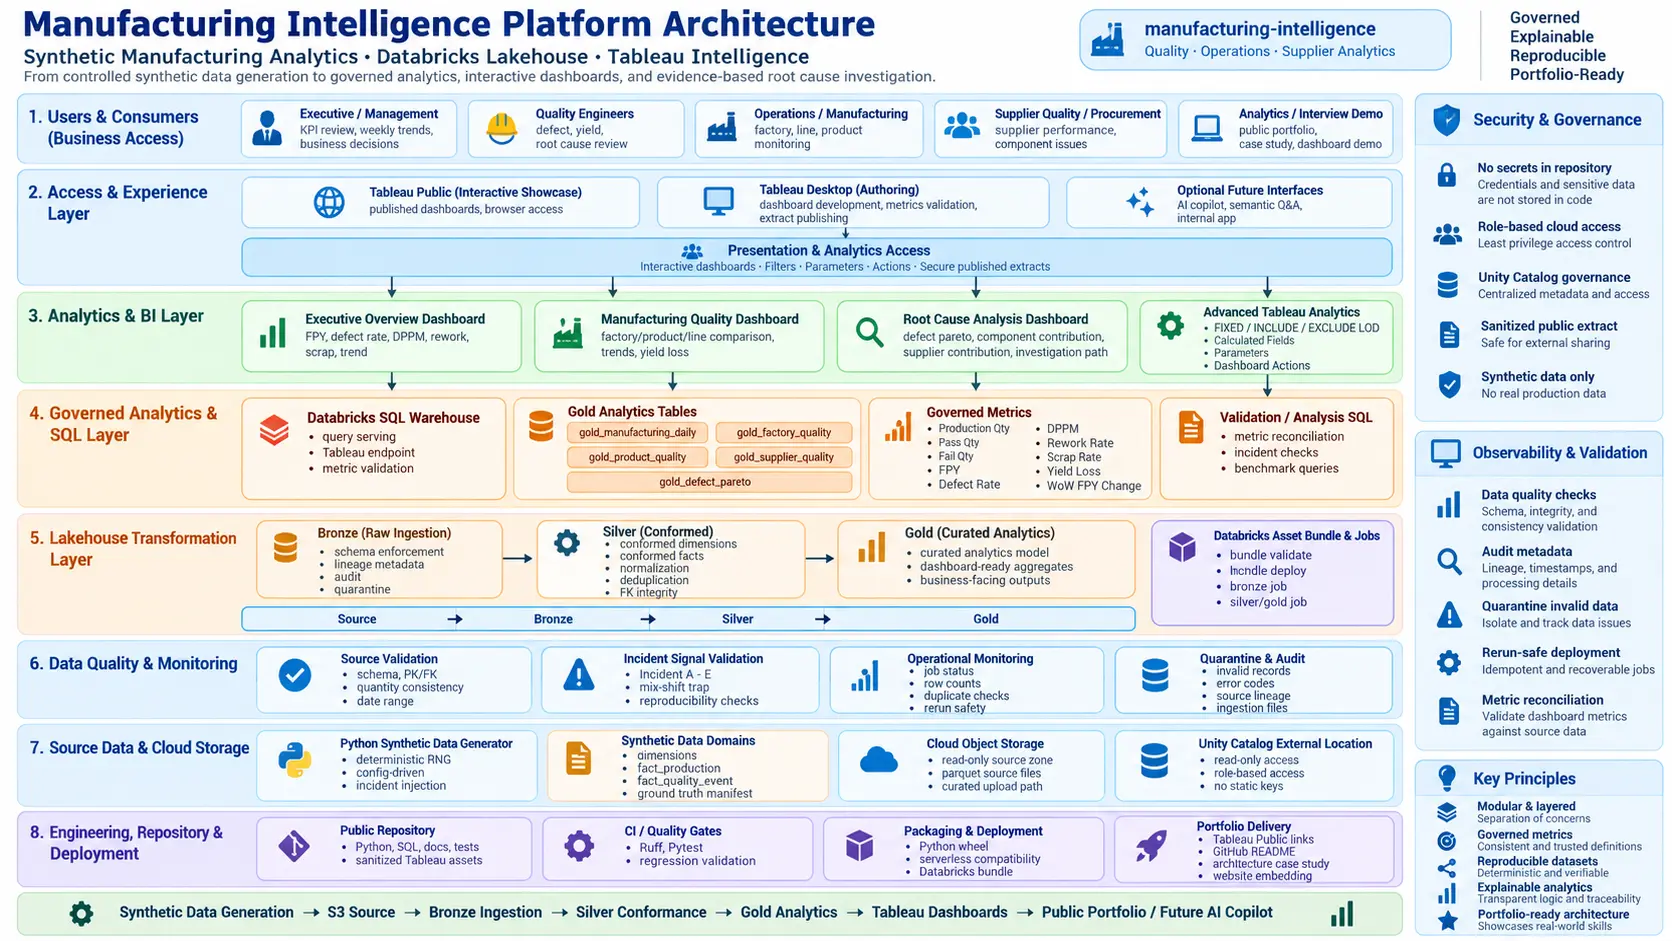
The complete path from data generation and lakehouse processing to governed analytics, monitoring, and delivery.
Business Problem
Business Problem
When First Pass Yield changes, an aggregate KPI alone cannot explain whether the cause is a real process issue, a localized supplier or component problem, or a shift in product mix. The platform creates a traceable route from the headline movement to governed evidence.
Architecture & Data Contracts
Architecture & Data Contracts
A deterministic Python generator produces synthetic manufacturing facts and dimensions. AWS S3 provides the source boundary, while Databricks ingests and transforms the data through Bronze, Silver, and Gold layers. Tableau reads only governed Gold tables rather than raw operational records.
Data Quality & Reliability
Data Quality & Reliability
Bronze ingestion enforces declarative schemas, routes invalid records to quarantine, records file-level audit metadata, and remains idempotent on repeated batches. Silver preserves fact grain while normalizing and validating relationships. Gold centralizes additive measures and rate definitions.
Analytics Experience
Analytics Experience
Three Tableau dashboards connect executive monitoring, quality analysis, and root-cause investigation. The first phase covers FPY, defect rate, production volume, Pareto analysis, factory, product, supplier, component, and defect perspectives.
Automated Acceptance
Automated Acceptance
A Databricks validation job checks Gold table inventory, deterministic row counts, KPI formulas, duplicate and quantity rules, and the expected evidence behind five synthetic incidents. Manual acceptance is reserved for Tableau layout, interactions, filters, tooltips, and final visual review.
Safe Public Delivery
Safe Public Delivery
The public workbook contains embedded synthetic extracts only. It does not include proprietary manufacturing data, a live Databricks connection, cloud hostnames, warehouse paths, access tokens, or credentials.
Engineering Takeaways
Engineering Takeaways
A credible dashboard begins before visualization: explicit grain, owned metric definitions, repeatable data generation, layer boundaries, failure handling, and automated reconciliation make the analysis explainable and maintainable.
Next Phase
Next Phase
Advanced Tableau analytics and deeper investigation patterns remain under validation. AI-assisted interpretation, supply-chain delivery, and field-RMA analytics are intentionally outside the completed first-phase scope.
Project links